Wednesday, August 17, 2011

War is on its last legs

Famine is not looking too great either. Pestilence and death are down but not nearly out.

The recent riots in London had all sorts of people claiming the world had gone Mad Max and it was time to shut down facebook and make all teenagers join the army. There is a great summary of the moral panic in this article "Civil disorder and looting hits Britain, We have been here before". I think its interesting how the rioting that probably wont even be visible in the end of the year crime statistics made everyone freak out so much.

For all the talk of moral decay is the world in general a worse place than it used to be? War along with the other horsemen is a pretty good definition of how bad things are. Unless Bob Geldof finally gets that concert to end death set up. Even pestilence would seem to be a big ask to fix. What is the trend for war deaths recently?

Many people have predicted a century of appalling death tolls from war. Robert McNamara the ex US defense secretary and self confessed war criminal (at 3:10 ) for example.
Blight and McNamara project the level of warfare forward into the twenty- first century based on population growth, and suggest a “speculative” but “conservative” estimate of “at least 300 million” fatalities from war in the twenty-first century, of which perhaps 75 million would be military

So how have we done in the last decade on the predicted 3 million deaths a year?
So far they haven't even been close. In fact, the last decade has seen fewer war deaths than any decade in the past 100 years, based on data compiled by researchers Bethany Lacina and Nils Petter Gleditsch of the Peace Research Institute Oslo. Worldwide, deaths caused directly by war-related violence in the new century have averaged about 55,000 per year, just over half of what they were in the 1990s (100,000 a year), a third of what they were during the Cold War (180,000 a year from 1950 to 1989), and a hundredth of what they were in World War II.
So there has been under 2% of the expected war deaths this decade.

The Quaker economist describes the decline with "Just in the last fifty years, the progress towards peace has been startling. If this trend continues — and I am cautiously optimistic that it will — then as pressure from civil society increases and international institutions of conflict resolution mature, warfare as a regular practice may cease sometime late this century."

While talking about sending the four apocalyptic horsemen to their dotage the decline of Famine is also impressive
On the day that a famine is declared in Africa -- thanks as much to Somalia's political dysfunctionality as to a severe drought -- comes news that the world drought severity index has been falling for three decades. You can check for yourself by going here and clicking on "make time series":


There are some fairly serious disclaimers on this famine decline. The first is that agricultural productivity growth is declining at the moment
combine this with a possible loss of farm productivity when global warming kicks in and there could be problems.

While on the subject of how things are not good but significantly better than they used to be the last decade was the best one in human history.
We estimate that between 2005 and 2010, nearly half a billion people escaped extreme hardship, as the total number of the world's poor fell to 878 million people.

Nearly everything is getting better. Including life expectancy which you could take as evidence that even death is not what he was. Oddly all three of these sources give different numbers on 'major armed conflicts' but all agree the number is declining.

If two of the biggest problems mankind has faced for all of history are on the decline so rapidly they could be almost unknown within our life times I would say that is good news. And probably more important evidence of how we are progressing than a few rioters stealing runners.

Monday, August 15, 2011

We are getting better at nearly everything

How quickly are humans getting better? We tend to think technology is getting better or that humans augmented by technology are improving. New swimming records happen regularly as swim suit technology improves. This post just throws up some evidence about human progress.

The Effect of Testing for Performance Enhancing Drugs on the Progress of World Records in Weightlifting “From 1964 to 1988 the relative strength of the world record holders in those weight classes increased by 21% …The same analysis in other types of sports, where there had been some changes in training methods over the same period of time, revealed that the maximum improvement was only 9%“ So most improvement in weightlifting seems to have been from pharmacological rather than having a wider range of people to select from or improved training mechanism reasons. However what about areas of human endeavour that drug taking seems unlikely to help?

In chess taking steroids seems unlikely to help. Though future nootropics might. "We conclude that there has been little or no ‘inflation’ in ratings over time—if anything there has been deflation. This runs counter to conventional wisdom, but is predicted by population models on which rating systems have been based…The results also support a no answer to question 2. In the 1970’s there were only two players with ratings over 2700, namely Bobby Fischer and Anatoly Karpov, and there were years as late as 1981 when no one had a rating over 2700 (see [Wee00]). In the past decade there have usually been thirty or more players with such ratings."

Even musicians are getting better Virtuosos Becoming a Dime a Dozen "The overall level of technical proficiency in instrumental playing, especially on the piano, has increased steadily over time." One good explanation for this and the chess improvement is just that more people are getting to try these, people who are not as limited by nutrition and disease as they would have been int he past.


This explanation is expanded in this rather good post "Two Hour Marathon in 2045"

"But the pipeline that selects and trains runners behaves, in some ways, like the model. If a person with record-breaking potential is born in Kenya, where running is the national sport, the chances are good that he will be found, he will have opportunities to train, and he will become a world-class runner. It is not a certainty, but the chances are good.

If the same person is born in rural India, he may not have the opportunity to train; if he is in the United States, he might have options that are more appealing.

So in some sense the relevant population is not the world, but the people who are likely to become professional runners, given the talent. As long as this population is growing exponentially, world records will increase linearly.

That said, the slope of the line depends on the parameter of exponential growth. If economic development increases the fraction of people in the world who have the opportunity to become professional runners, these curves could accelerate."

Progress of things like number of children suffering malnutrition and having clean water can really result in increasing the number of great chess or piano players as well as the world running record. We are getting better at loads of things because more people are getting to try them without the poverty induced hinderances they used to have. According to this model it is not that population is increasing exponentially but at the moment population of people who have a chance at being great at something is.

If you have other explanations for why and in what human achievment is progressing I would love to hear them.

Tuesday, August 09, 2011

Do Budget Cuts and Riots Go Together?


I saw this paper 'Austerity and Anarchy: Budget Cuts and Social Unrest in Europe, 1919-2009'
with the intro
'In the wake of this week's London riots, some commentators have linked the youth unrest to budget cuts. The authors of CEPR DP8513 explore the historical basis for this view and finds that austerity and violence have tended to go hand in hand.'

I am reading through the paper now. But I wonder if there was an image that could quickly show a connection between the two.

Wikipedia lists the riots since 1950 as

1958 Notting Hill race riots
1970 Garden House riot
1971 Priestlley riots
1975 Chapeltown race riot
1977 Battle of Lewisham
1980 St. Pauls riot
1981 England riots · Brixton riot · Chapeltown race riot · Toxteth riots · Moss Side riot · Handsworth race riots
1985 Brixton riot · Broadwater Farm riot
1987 Chapeltown race riot
1989 Dewsbury race riot
1990 Strangeways Prison riot · Poll Tax riots
1991 Meadow Well riots
1995 Manningham riot · Brixton riot
2001 Bradford riots · England riots · Oldham race riots · Harehills riot
2005 Birmingham race riots
2010 UK student protests
2011 London riots

Now if you look at the government spending as a percentage of GDP here. On top of this graph I put a bar for every riot each year one occurred.

Counting all riots as the same is not fair. Their graph goes from 34->48 whereas the riots go from 0->6. Laying the first on the second is not considered good practice in data visualisation. Also and this is a big one. If GDP drops as in a recession and the percentage of government spending to GDP stays the same total government spending will drop. a fairer graph would look at gdp or government spending adjusted compared to riots not the two combined.

The proper paper says rioting and austerity go hand in hand. I will read it carefully to see how close the link is. But a quick look at the data and no obvious major link jumps out at me.

Friday, August 05, 2011

We have reached Peak Baby


When will we reach peak babies? In what year will the most children be born? I bet last night a shiny pint that we will reach peak babies in the next three years. That the most babies ever born will be in a year before 2015.

Now I accept that we could never actually know how many children will be born in the future. The bet will end when I present enough evidence to convince those I am betting with rather than with a proof. Demographics is regarded as one of the most predictable of social sciences but some possible future invention could drastically increase the number of babies. We could have brave new world style artificial wombs of some such that vastly increases the birth rate for example.

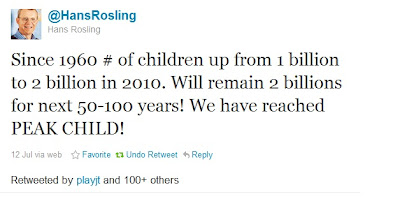
Hans Rosling the statitician tweeted recently.

I looked up the UN data on this here. In detailed indicators look in births and in select country look in world. The highest birth number in the world was 1985-1990
Period Births per year
1950-1955 97 769
1955-1960 102 894
1960-1965 110 280
1965-1970 118 200
1970-1975 121 715
1975-1980 120 676
1980-1985 129 088
1985-1990 137 207
1990-1995 134 960
1995-2000 132 473
2000-2005 131 644
2005-2010 134 072
2010-2015 135 775
2015-2020 135 396
2020-2025 133 800
2025-2030 132 452
2030-2035 131 991
2035-2040 132 099
2040-2045 131 926
2045-2050 131 127
2050-2055 129 904
2055-2060 128 785
2060-2065 127 998
2065-2070 127 402
2070-2075 126 725
2075-2080 125 823
2080-2085 124 775
2085-2090 123 753
2090-2095 122 837
2095-2100 121 992
Now it could all of a sudden rise up and any prediction for the future is unlikely to be as accurate as historical estimates. Still I think I win the bet.

This does not mean that population will drop. As we are living longer world population is still expected to grow. But it does mean we can say that Malthus was wrong. Human numbers will not grow exponentially barring some disaster.

Thursday, August 04, 2011

Crowd Sourced Optimal Fantasy Football Team


All my fantasy football attempts have the problem that I know nothing about football. So for example Berbatov is unlikely to do as well this season as last season so picking him would seem unwise. But how does someone who knows nothing about football find out who will play well next season?

The wisdom of the crowds is the James Surowiecki about "the aggregation of information in groups, resulting in decisions that, he argues, are often better than could have been made by any single member of the group." This sort of thing does not work if the crowd has a bias in a particular direction.

I decided to look at the people is the "team selected by %" that fantasy premier league shows you. If I rerun the optimisation described in this post but instead of trying to great a team that has the maximum number of points last season I try and get the team whose players have been selected by the most other fantasy football managers.

The idea is that a team with the right number of defenders, goalkeepers, midfielders and forwards, that has at most three players from one team, that costs less than 100 and whose members have been picked most often should be really good.

The most popular team is

Player Club Pos Price Pts people
7 Al-Habsi WIG GK 45 125 199410
30 Bale TOT MID 80 118 189087
37 Barton NEW MID 60 131 123865
69 Cahill BOL DEF 55 105 180751
184 Given AVL GK 50 0 215091
205 Hangeland FUL DEF 65 154 192333
231 Huth STO DEF 60 138 165684
266 Kompany MCI DEF 60 95 197352
323 N'Gog LIV STR 55 48 279932
334 Odemwingie WBA STR 75 171 218485
421 Suarez LIV STR 95 68 343361
424 Taarabt QPR MID 65 0 141086
452 Vidic MUN DEF 80 148 172773
472 Wilshere ARS MID 65 93 220381
477 Yaya Toure MCI MID 80 146 167706

Some of these players were probably picked for the first few games and will be transfered out when they are about to play tougher games.

The average player is picked 26794 times. These players have been picked 200486 people on average.
This team would have scored 1415 points last season. The best team I could have picked for last season would have scored 2332 points. I have updated the dataset to include this people picked statistic.

Monday, August 01, 2011

Fantasy Football Optimization 2


So it turns out I was thick last post about picking the fantasy football team. As my friend Bren explained to me "you choose 11 players to be "on the pitch" each week, plus a captain who scores double (and a vice captain in case the captain doesn't play). can only have 1 keeper in the first 11, can choose any formation with a minimum of 3 defenders, 3 midfielders and 1 forward."

So the problem is now pick 11 players that will actually play and some really cheap players that won't

So whats the cheapest of each player you could get?
The cheaperst players in each position are about 4 or 4.5 each. For example
Goalkeeper
Moreira SWA 4.0 0
Defenders
Whitbread NOR 4.0 0
Tate SWA 4.0 0
Midfield
Lappin NOR 4.5 0
Gecov FUL 4.5 0
Allen SWA 4.5 0
Strikers
Miller WBA 4.5 6
Hulse QPR 4.5 0
Agyemang QPR 4.5 0

So if you picked from this price of player knowing they would not play that would allow you to spend more money on those that were on the pitch. Now defenders score less points than midfielders and strikers so lets say we only want three of them. And we then buy two cheap ones that we dont play. 2 cheap defenders costs 8 and one goalie for 4 means we now have 88 to pick the remaining 12 players. The case whether you should have 5 midfielders or 3 strikers is less clear. I will try both and see which has a higher score.

Attempt 1. Cheap goalie and 2 defenders and 1 midfielder. Cost 16.5 on 4 non playing players. Trying to have 3 strikers. The constraints would now be
num_goalkeepers <- 1
num_defenders <- 3
num_midfielders <- 4
num_strikers <- 3
max_team_cost <- 835
max_player_from_a_team <- 3

Gives a team of

1 Hart MCI GK 70 175
48 Ivanovic CHE DEF 70 144
49 Huth STO DEF 60 138
51 Hughes FUL DEF 50 129
197 Adam LIV MID 90 192
198 Malouda CHE MID 105 186
200 Dempsey FUL MID 85 168
201 N'Zogbia WIG MID 75 167
210 Jarvis WOL MID 60 133
386 Berbatov MUN STR 95 176
388 Odemwingie WBA STR 75 171

scoring 1779. You would make Adam your captain and he would have double points.

Attempt 2. Cheap non playing goalie and 2 defenders and 1 striker. Trying to have two strikers. Cost 16.5 on 4 non playing players.
num_goalkeepers <- 1
num_defenders <- 3
num_midfielders <- 5
num_strikers <- 2
max_team_cost <- 835
max_player_from_a_team <- 3

1 Hart MCI GK 70 175
48 Ivanovic CHE DEF 70 144
49 Huth STO DEF 60 138
51 Hughes FUL DEF 50 129
197 Adam LIV MID 90 192
198 Malouda CHE MID 105 186
200 Dempsey FUL MID 85 168
201 N'Zogbia WIG MID 75 167
210 Jarvis WOL MID 60 133
386 Berbatov MUN STR 95 176
388 Odemwingie WBA STR 75 171

with a score of 1769. Again Adam would be your captain. It looks like three strikers is a better plan than 5 midfielders. But it is a close run thing.

Just to make things really complicated Bren explained that you should generally have one good player on the subs bench in case one of the rest of the team is injured. "it's quite common for one of the main team to miss a week so you may need to make 1 sub an excellent player (probably defender since they're cheaper)". Having a defender as your good sub has the advantage that you are allowed to play with one forward and three midfielders so if one of your three forwards, four midfielders or three playing defenders gets injured a defender can sub in for any of those.

So assuming we actually want four defenders. We would have one cheap goalie and one cheap defender and one cheap midfielder. At a cost of 12.5 for non playing players.
num_goalkeepers <- 1
num_defenders <- 4
num_midfielders <- 4
num_strikers <- 3
max_team_cost <- 875
max_player_from_a_team <- 3

giving a team of


Player Club Pos Price Pts
1 Hart MCI GK 70 175
46 Cole A CHE DEF 75 150
49 Huth STO DEF 60 138
51 Hughes FUL DEF 50 129
54 Bardsley SUN DEF 50 123
197 Adam LIV MID 90 192
200 Dempsey FUL MID 85 168
201 N'Zogbia WIG MID 75 167
203 Downing LIV MID 85 163
386 Berbatov MUN STR 95 176
388 Odemwingie WBA STR 75 171
393 Davies K BOL STR 65 132


1884 points -123 as Bardley wont play = 1761. Basically Bardsley a Sunderland defender is really cheap at 5. This is one more than you pay for a player you don't want to play but if you do need to lay him he gets 123 points a season.
Davies looks a little low there with 132 points. The worst midfielder has 163 points. So what if we get rid of the third striker and try 5 midfielders?

num_goalkeepers <- 1
num_defenders <- 4
num_midfielders <- 5
num_strikers <- 2
max_team_cost <- 875
max_player_from_a_team <- 3


Player Club Pos Price Pts
1 Hart MCI GK 70 175
46 Cole A CHE DEF 75 150
49 Huth STO DEF 60 138
51 Hughes FUL DEF 50 129
53 Distin EVE DEF 55 124
197 Adam LIV MID 90 192
200 Dempsey FUL MID 85 168
201 N'Zogbia WIG MID 75 167
203 Downing LIV MID 85 163
210 Jarvis WOL MID 60 133
386 Berbatov MUN STR 95 176
388 Odemwingie WBA STR 75 171

1886-124 for Distin who usually wont play = 1762. So this is my best single fantasy football team of last season.

The more I learn about this game the more nuances it has. Off the top of my head
1. Model that the captain gets double points. In this case Adam the highest scoring player is actually quite cheap. But in the case where he was really expensive you would want to take into account that he can earn double points.
2. Take into account who teams are playing. With a full game by game scoring dataset you can investigate really interesting patterns like if playing top five club means less points and bottom five more. And if so make transfers based on upcoming games. This seems to be where a huge amount of the skill in fantasy football is.
3. Change the code so you can have 3->5 defenders, 3-5 midfielders and 1-3 strikers but only 11 total players.
4. Just picking cheap non playing players is probably wrong. You at least want to pick the best cheap players you can. Which I have not. I am told Shane Ferguson is a good buy so I will probably make him one of the cheap players.

If any of the intuitions about having a good substitute or any of my other assumptions are wrong please correct me.
If you predict different points for players this season. If you want to try this method for next season but dont want to run the program linked to in part one


1. Copy the dataset I have here
2. Put this data into a new google docs spreadsheet.
3. Make your predictions on the number of points they will score. So if you think Berbatov won't score 176 points this season but only 160 change that points value. You can delete players you are not interested in as well.
4. Put your new spreadsheet URL in the comments
and I will run a optimization over your predictions for you.