Monday, February 25, 2019

February is Hot

At the moment it is really hot. 20°C is ridiculously hot for this time of year.

Central England has weather data going back a long time. 1772 for daily average temperature and 1878 for maximum and minimum temperatures on each day.

2 times February the 25th since 1772 had an average temperature for the day above 10°C in Central England 1790 with 10.7°C, and 1922 with 11°C

The maximum temperatures observed in central England on the 25th of February were 1922 with 14.1,1953 with 13.1 and 1976 with 13.1 For those 140 years the maximum daily temperature averaged 6.6C.

I put the code to work all this out here. Graph of Feb 25th max temperature shows how weird 20°C is

It takes a while for the HADCET data to be updated. There is a nearby weatherstation http://www.weathercast.co.uk/world-weather/weather-stations/obsid/99060.html when I figure out the relationship between the two it will be possible to do a comparison between today and all the previous years.

Tuesday, February 05, 2019

English soccer is not normal

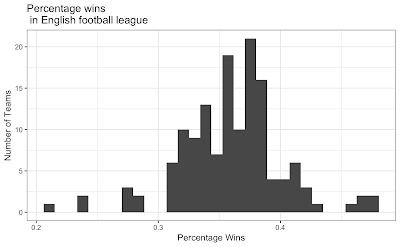
Are wins in football normally distributed? If they are not it might affect how we should calculate the probabilities of teams winning.

Baseball wins seem not to follow a normal distribution

There is a great R Package dataset of football results by James Curley here. This engsoccerdata has a function to generate soccer league tables of many countries over a long time period.

       league<-maketable_all(df=england[,])


team GP W D L gf ga gd Pts Pos

1 Manchester United 962 604 209 149 1856 847 1009 2021 1

and create a new column for the percentage of wins

       league<-league %>% 
    mutate(PercentW = W / GP)

p<-ggplot(data=league, aes(league$PercentW)) + geom_histogram()
#binwidth=20
p<-p + ggtitle("Percentage wins\n in English football league") +   xlab("Percentage Wins") + ylab("Number of Teams")
p<-p+theme_update(plot.title = element_text(hjust = 0.5))
p<-p + theme_bw()


       library(fitdistrplus)
library(logspline)
x<-league$PercentW
fit.norm <- fitdist(x, "norm")
plot(fit.norm)


       shapiro.test(x)       
 
Shapiro-Wilk normality test

data: x W = 0.96276, p-value = 0.0006663 Which means English football wins really do not have a normal distribution.

Goals per game are also not normally distributed. But I dont think anyone expectes them to be

       
league<-league %>% 
    mutate(GoalsPgame = gf / GP)
shapiro.test(league$GoalsPgame)


Shapiro-Wilk normality test data: x W = 0.92134, p-value = 4.818e-07

And for France

Shapiro-Wilk normality test

data: leagueF$PercentW W = 0.98522, p-value = 0.4699 so French football wins do not have might have (thanks for Paulfor the correction in the comments) a normal distribution. I must check the other leagues in the dataset as behaviour this different is odd.