There is a strange graph that is common in Climate Change denying circles.
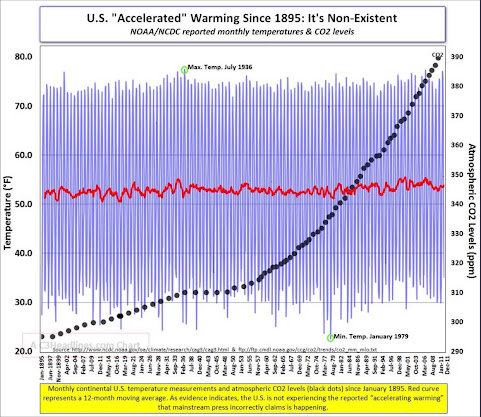
The issues I see with it are
- It only goes up to 2011. More recent data should be included.
- The second access of CO2 is very weird. Generally 2 Y-axis graphs are frowned up and here it is confusing.
- The graph shows US but the claims around it are about the World. Which are two very different things.
The link in the graph no longer seems to be working http://ncdc.noaa.gov/oa/climate/research/cag3/cag3.html
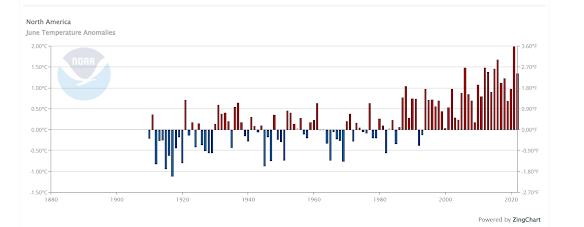
The Noaa does have data for North America still and it shows warming in the last decade https://www.ncei.noaa.gov/cag/
No comments:
Post a Comment