Showing posts with label economics. Show all posts

Friday, December 17, 2021

A Patreon for Materials

Prizes are a really good way of funding science but are not used enough. All sorts of prizes from longitude to private space have speed up technological development in their area.

Kaggle is an interesting example of current innovation incentivised using prizes. Kaggle defines a metric over a dataset and people try an build models that predict that well. This is then tested over another dataset to prove your predictions are the best. For not very much money a large number of very skilled people work on a defined problem for fun, kudos and the possibility of profit.

  1. Typical Kaggle competition lasts 3 months, offers $25,000-100,000 in prize fund and attracts around 1000 specialists

  2. At least top 10% of those specialists, ~100 persons are of prime quality, many others 'just' good.

Could a similar thing be done for discovering materials with properties we want? There are all sorts of problems that could be solved with materials with new properties. There are commercial incentives to develop many useful materials already. A more efficient solar panel or energy dense battery could have such commercial value lots of people are working on making them already. But some properties of materials are known to be useful but not commercialised yet to have huge competition or budgets trying to create them.

If we agree prizes are a useful incentive. And that we need new materials with useful properties how might a kaggle for such prizes work?

Kaggle has test datasets unknown to competitors held out to prove later which prediction model is best. For a materials version proving specific qualities in the lab would, initially, be too expensive. Relying on the scientific peer review process, of quality journals, would probably be enough initially. Occasionally issues in published materials research comes to light. But that happens in kaggle competitions too. And with prizes fairly low the incentives for shenanigans are not huge. Use a paper being published by a high quality journal as proof that a material has the defined property.


How long would the competitions be open for? The millenium prize for solving known big hard maths problems are open ended. Kaggle competitions are shorter a few month time periods. The time needed for journal papers to be approved and the difficulty of making materials means a year is probably more practical. Having a year competition timeline makes it more open to tinkerers than big grand ambitious challenges. I think 'A prize to someone who makes a wire room temperature superconductor at atmospheric pressure' is too ambitious. 'A prize to someone who publishes the warmest superconductor in a substance that can be turned into a wire by December 2022' is more practical. Competitions for improvements of a defined characteristic over a period of a year or two seem to be the best prize incentives to me.

How much would the prizes be for? Using journals keeps the cost of running the competitions low. But also means huge amounts of money cannot be involved. Also unlike kaggle a company putting up a dataset is not paying the prizes. The prizes would just be donated by people who can see that creating a product with these properties would be useful for improving our lives. As such a Patreon like model where donations are collected would probably be best. Stripe lets foundations setup as non profits set up these sorts of donations. Prizes would probably be in the 100K to -> 1 million range but initially to prove the concept would be much lower. 

What would be a good initial material quality to test this Patreoned Kaggle for materials idea on?

Tuesday, July 20, 2021

Foxconn Automation Reducing Employment

Around 2016 there was large interest in how factory automation was going to lead to mass unemployment. And this was one of the reasons given for why Universal Basic Income would be introduced.

But have the predictions of then happened? Foxconn was one of the big companies in the news about this at the time.


iPhone manufacturer Foxconn plans to replace almost every human worker with robots

Foxconn had 837000 workers in 2016 30% less now would be 587,000 employees. Instead Foxconn in 2020 employed around 1.29 million people.
There could be more going on here. Mergers could increase the size of the company. But on the raw figure nothing like the 30% reduction in staff happened. 

Saturday, November 21, 2020

What jobs have most risk of Covid?


This data is Norway but I will assume the US and other countries would be similar. The full paper is Occupational risk of COVID-19 

"The difference between the first and second wave may be due to changes in the test criteria. In the first wave, there was a shortage of test equipment, and patients, risk groups and healthcare personnel were prioritised for testing. In the second wave, close contacts and people with mild symptoms could also be tested. " so I'll use the figures from the second wave for the risk.


How many people have these jobs? The US bureau of Labour Statistics has good numbers on occupations here 


I took all these jobs and got the numbers of US workers with them and their chance of getting ill. It works out that about 10% of workers account for 30% of cases (in workers). That is still about 16 million people. But it does give a possible next group for vaccines after medical workers. I put the combined risk and numbers employed data into a spreadsheet here 


Tuesday, June 09, 2020

Judging Trump's Presidency

Early 2017 I gave some metrics here that could be used to judge Trump's presidency a success on his own terms. Dues to the pandemic I do not think it is fair to judge from 2020 on. But how did he do in the previous three years?
The metrics were

1. Better healthcare. Cover Everybodycost less and have lower deducables

Didn't happen
'In 2018, 8.5 percent of people, or 27.5 million, did not have health insurance at any point during the year. The uninsured rate and number of uninsured increased from 2017 (7.9 percent or 25.6 million).The percentage of people with health insurance coverage for all or part of 2018 was 91.5 percent, lower than the rate in 2017 (92.1 percent).


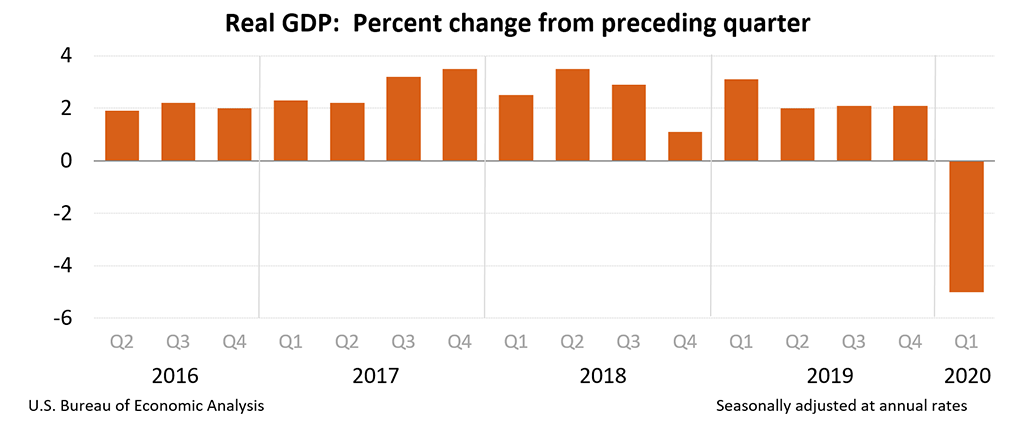
2. More GDP Growth. 'If Trump can deliver an average of more than 3% over his 4 years in office I think an impartial observer would agree the economy has done well.'

Didn't happen


3. A balanced Budget.
Didn't happen
"The budget deficit increased from $779 billion in FY2018 to $984 billion FY2019, up $205 billion or 26%. The budget deficit increased from $666 billion in FY2017 to $779 billion in FY2018, an increase of $113 billion or 17.0%.[10] The 2019 deficit was an estimated 4.7% GDP, up from 3.9% GDP in 2018 and 3.5% GDP in 2017. The historical average deficit is 2.9% GDP" 
4. Infrastructure improvements are a big part of Trumps promise. These are measured here
Didn't happen
2018 US was 14th in the world in world bank LPI rank. Infrastructure score 4.05
2016 US was 10th in the world. Infrastructure score 4.15

On none of the four metrics declared in January 2017 has Trump's presidency succeeded in, in the time before the pandemic.

Monday, June 15, 2015

When did we get too much stuff?

Kevin Kelly pointed out that we have more types of things (species of technology) than even the most wealthy had in the past. "count the number of species of technology in our household. And it came up with 6,000 different species of products. I did some research and found out that the King of England, Henry VIII, had only about 7,000 items in his household. And he was the King of England, and that was the entire wealth of England at the time." Kevin Kelly

How much more stuff can we get over time? The Argos catalog seems to get bigger each year and it seemed to me an ideal way to measure the amount of stuff we get to decide we don't want.

Retromash is a great site for old Argos catalogs. I Counted the total page numbers in each years catalog. I don't have the slaves undergraduates needed to count everything in the actual catalog. Retromash don't have much after 1990 so I went to ebay and they list the number of pages. This produces this data (with links to the ebay sources). One weirdness is there seemed to have been an instore catalog and superstore (to be delivered) catalog for a few years.

I have tried to give the number of pages of the Autumn/Winter Argos catalog you get in the shop in any given year.

The graph is just a simple ggplot2 scatterplot

mydata = read.table("argos.tsv", header=TRUE)

ggplot(mydata, aes(x=Year, y=pages)) + geom_point(shape=1) + geom_smooth(method=lm, se=FALSE)

ggsave(file="argos.png")

It looks like there are nine times the number of things we can choose now from Argos as there was in 1975. To put a prediction on this, the amount of things you can buy nearby doubles ever decade.

Tuesday, May 19, 2015

Uhaul Map of the US

You rent a Uhaul truck in New York to move to a new job in Texas. UHaul will be left with a truck in Texas. If people really want to go New York -> Texas but less so Texas-> New York they will reduce the price of the Texas -> New York. If you get all the prices to move one way between all the cities in the US you end up with a good idea of where people are moving. And as people usually move for jobs where the jobs are.

The idea I saw first in Marginal Revolution. This blogpost seems to be where the whole UHaul weighted graph idea came from. Dan Armstrong and Páll Hilmarsson
I took a list of the 34 most populous US cities (all over 500,000) from wikipedia. This is 1122 links in total. The 294 cities is 86142 total links. You only seem to be able to get containers not trucks from Honolulu, Hawaii.
This is a Complete graph where each edge has a length and a weight/capacity (price). some cities are really cheap to leave because enough people are moving (sinking) there that UHaul want to get the trucks back to the cities people are leaving (source) The extreme costing trips are

Source Destination Price
San Jose, CA Washington, DC 4237
San Francisco, CA Baltimore, MD 4188
San Jose, CA Baltimore, MD 4181
San Jose, CA Washington, DC 4132
Baltimore, MD Washington, DC 74
Washington, DC Baltimore, MD 79
You can get the spreadsheet with all 1122 trips here

The trips with the biggest difference between one way and another are by price

Source Destination Round dif Round ratio
San Jose, CA Washington, DC 2404 2.3
San Francisco, CA Washington, DC 2345 2.3
Philadelphia, PA Portland, OR 2213 3

and by ratio

San Francisco, CA Las Vegas, NV 608 4.1
Source Destination Round dif Round ratio
San Jose, CA Las Vegas, NV 580 4.1
San Francisco, CA Las Vegas, NV 608 4.1
Philadelphia, PA Jacksonville, FL 1301 3.9

The spreadsheet with these calculation is here. the code to work all this out is pretty raw but it is here.
I will come back to this later and work out Eigenvalue Centrality and maybe how distance relates to prices. Also it would be interesting to see if some places are summer sinks and some winter sinks in a few months time.

Saturday, April 18, 2015

Peak Loom Band

I was talking to the owner of a craft shop today. She told me she knew of many people who were stuck with stock from the loom band craze of last year. Waterford Whispers reported it as "Parents Urged To Hack Off Any Child’s Arm That Comes In Contact With Loom Bands".


A Google Trends shows the craze's lifespan


By the end of summer all that was left was a bin of tiny plastic hoops at bargain prices. Are crazes lasting less time now?


The Age Of Earthquakes points out


Crazes end. This is not like the Tulip or the South Seas Bubble. I don't remember hearing people would get rich selling loom band to each other. Unlike the way Beanie babies were sold as an investment. The sort of thing you could split up during a divorce


BTW she thinks Parachute Cord will be the next craze

Wednesday, February 04, 2015

Irish Alcohol Consumption in 2020

Drink blitz sees bottle of wine rise to €9 minimum 'Irish people still drink an annual 11.6 litres of pure alcohol per capita, 20pc lower than at the turn of the last decade. The aim is to bring down Ireland's consumption of alcohol to the OECD average of 9.1 litres in five years' time.'

What would Irish alcohol consumption be if current trends continue? Knowing this the effectiveness of new measures can be estimated.

The OECD figures are here. I put them in a .csv here.The WHO figures for alcohol consumption are here I loaded the data in R Package

datavar <- read.csv("OECDAlco.csv")

attach(datavar)

plot(Date,Value,

     main="Ireland Alcohol Consumption")
Which looks like this

Looking at that graph alcohol consumption rose from the first year we have data for 1960 until about 2000 and then started dropping. So if the trend since 2000 continued what would alcohol consumption be in 2020?

'Irish people still drink an annual 11.6 litres' I would like to see the source for this figure. We drank 11.6 litres in 2012 according to the OECD. I cannot find OECD figures for 2014. In 2004 we drank 13.6L the claimed 20pc reduction of this is 10.9L, not 11.6L. Whereas the 14.3L we drank in 2002 with a 20pc reduction would now be 11.4. This means it really looks to me like the Independent were measuring alcohol usage up to 2012.

Taking the data since 2000 until 2012.

newdata <- datavar[ which(datavar$Date > 1999), ]

detach(datavar)

attach(newdata)

plot(Date,Value,

     main="Ireland Alcohol Consumption")

cor(Date,Value)

The correlation between year and alcohol consumption since 2000 is [1] -0.9274126. It look like there is a close relationship between the year and the amount of alcohol consumed in that time. Picking 2000, near the peak of alcohol consumption, as the starting date for analysis is arguable. But 2002 was the start of this visible trend in reduced alcohol consumption.

Now I ran a linear regression to predict based on this data alcohol consumption in 2015 and 2020.

> linearModelVar <- lm(Value ~ Date, newdata)
> linearModelVar$coefficients[[2]]*2015+linearModelVar$coefficients[[1]]
[1] 10.42143
> linearModelVar$coefficients[[2]]*2020+linearModelVar$coefficients[[1]]
[1] 9.023077
> 
This means based on data from 2000-2012 we would expect people to drink 10.4 litres this year. Reducing to drinking 9 litres in 2020. So with current trends Irish alcohol consumption will be lower than 'the aim is to bring down Ireland's consumption of alcohol to the OECD average of 9.1 litres in five years'.

There could be something else that is going to alter the trend. One obvious one would be a glut of young adults. People in their 20 drink more than older people. If there are a higher proportion of youths about then the alcohol consumption will rise all else being equal. So will there be a higher proportion of people in their 20s in 5 years time?

The population pyramids projections for Ireland are here. Looking at these there seems to have been a higher proportion of young adults in 2010 than there will be in 2020 which would imply lower alcohol consumption

it would be interesting to see the data and the model that the prediction of Irish alcohol consumption are based on. And to see how minimum alcohol pricing changes the results of these models. But without seeing those models it looks like the Government strategy is promising current trends to continue in response to a new law.

Thursday, November 14, 2013

Wheat Map of the US

I thought it would be cool to make a map of the US counties by how much wheat they grew. I took the code from this article and from the Visualize Data book by Nathan Yau

I got some wheat data from here the US department of Agriculture. The map of the US comes from here

Then I cleaned up the data by taking only the columns for state, county and total wheat production. This dataset includes a county 888 and 999 but that seems to be a combination of all the states counties so I stripped those out. Also there are more than 50 states in these county datasets which seems to be standard. There is always messing with numbers being seen as strings with these sorts of manipulations so some casting is needed.

The svg is 1.9 mbs and google drive does not want to store or convert it at the moment but if anyone wants it I can send it to them. This quality of file means zooming in on an individual state, like Kansas, is fine.

The code to create this picture is here.

JDLong on twitter pointed out where to get data for countries. I got the grains from here and a look at the 'head psd_grains_pulses.csv' shows the file layout

I think I want Country_code and value for the commodity wheat in every country in the most recent year value. The country code is 2 characters (iso 3166-1 alpha 2) and the map I have from wikipedia is that format you can get it here

The code to produce colors for each country based on this data is here. Again this is based on the "Visualize This" book from Yau. This css code to set the color of each country gets pasted into the style section of the BlankMap-World6.svg file. I should read all the documentation describing the values before doing any analysis like this. But I am only doing this to make pretty pictures in Python so I am making assumptions to work quickly.

extra: I made a stacked area graph of what crops have been grown when here with the code here.

Monday, December 24, 2012

The Price Of Guinness

When money's tight and hard to get 
And your horse has also ran, 
When all you have is a heap of debt - 
A PINT OF PLAIN IS YOUR ONLY MAN.
Myles Na Gopaleen

How much has Guinness increased in price over time? Below is a graph of the price changes. The data is taken from a combination of the Guinness price index and CSO data

The R package code for this graph is below.

pint<-read.csv('pintindex.csv', sep=',', header=TRUE)
plot(pint$Year, pint$Euros, type="s", main="Price Pint of Guinness in Euros", xlab="Year", ylab="Price Euros", bty="n", lwd=2)
dev.print(file="Guinness.jpeg", device=jpeg, width=600)       
dev.off() 
Paul in the comments asked a good question. How does this compare to earnings?
        price   Earnings/Price     Earnings per Week (Euro)
 2008   4.22    167.31                 706.03
 2009   4.34    161.69                 701.73
 2010   4.2     165.02                 693.08
 2011   4.15    165.81                 688.11
 2012   4.23    163.56                 691.87
Here the earnings are average weekly earnings which is the modern and slightly different value to average industrial wage which the Pint Index used. It shows that even with a price drop in Guinness the total purchasing power of pints with wages decreased. This is based on gross wages increases in tax probably made the situation based on net wages worse.

Pintindex.csv is

Year,  Euros 1969, 0.2 1973, 0.24 1976, 0.48 1979, 0.7 1983, 1.37 1984, 1.48 1985, 1.52 1986, 1.64 1987, 1.73 1988, 1.8 1989, 1.87 1990, 1.93 1991, 2.02 1992, 2.15 1993, 2.24 1994, 2.34 1995, 2.42 1996, 2.5 1997, 2.52 1998, 2.65 1999, 2.74 2000, 2.88 2001, 3.01 2002, 3.24 2003, 3.41 2004, 3.54 2005, 3.63 2006, 3.74 2007, 4.03 2008, 4.22 2009, 4.34 2010, 4.2 2011, 4.15 2012, 4.23

Sunday, December 18, 2011

How much would a driverless taxi cost?

This is a post where I do a back of the envelope estimate of when we'll see driverless cars, what will they do to taxi costs and what will that do to unemployment.

There are several estimates to when driverless cars will arrive. The New York time estimates 2020.
Self-Driving Cars
By 2030, Sebastian Thrun predicts, more people will use self-driving cars in their daily commute than manually driven cars.
Submitted by Sebastian Thrun, developer of Google’s self-driving car.
Our readers predict this will occur around 2020, having moved this date 1381 times.

Many similar bets of Driverless cars being regular enough in 2020 and ubiquitous in 2030 exist for example here,
By 2020 - Driverless cars are commercially-available and street-legal somewhere in the United States.
By 2027 - New driverless cars outnumber new cars requiring at least some human control, in the US market.

and here
By 2019, it has begun spreading to public roads, with significant numbers of driverless trucks appearing.

and here
In my post last week, my commentors took me to task on my prediction that cars will drive us in ten years. Some thought Americans would wise up and learn to love mass transit. They don't know Americans.

Others thought the hardware cost would even in ten years remain out of reach. Google did not build an autonomous car by creating the hardware but by harnessing and training good machine learning algorithms. No amount of hardware would have given you a car able to navigate the streets of San Francisco five years ago.


What effect will these cars have? There are all sorts of ideas about how they will alter parking and car ownership. I'm going to try do a back of the envelope here on how much Taxi fares will cost if you don't have to pay the driver.

Taxis cost about 120 cent for a kilometer

For each additional 1/6th of a kilometre or time 28 seconds)

(a) Day time 8am to 10pm €0.15
(b) Night time 10pm to 8am €0.20
(c) Sundays, Public Holidays, Christmas Eve and New Year’s Eve €0.20

Ignoring the pick up costs of about 3.40.

The AA says it costs around 25 cent per kilometer to drive a car in Ireland. About 25 pence per mile in the UK. Taxis charge 1.20 so the majority of the cost looks like the driver. You would have extra costs on top of a normal car with a commercial vehicle. But given the pick up costs a driverless taxi could be about a quarter the cost of a taxi with a driver.
The price elasticity of demand should allow an estimate of how this will alter taxi usage. This paper "Estimation of Price Elasticity for Taxi Services in Hassel" gives a PED of -2.644. Though others such as Schaller at -.22 and here of -.6 shorter term. Taxis that cost a quarter the current price with a PED of -2.6 would mean about ten times the number of taxi journeys. The long term viability of public transport should take this possibility into account. If by 2030 people will be taking ten times the number of taxi journeys would enough people be using Metro North to make it cost effective?

Transport employs nearly one hundred thousand people in Ireland. Which is about 1 in 20 people who have a job here. Or about a third of the number of unemployed. I doubt everyone who works in transport will lose their jobs overnight. But taxis provide an example of how economic effects could provide a huge incentive to move to driverless cars. So far technological progress has always eventually resulted in new jobs to replace old lost ones. The money people save getting into town for a night now could end up being spent in town and require more employment in restaurants and bars for example.

But I think it is worth considering the possibility that fairly soon we could have nearly a hundred thousand people who earn a decent wage at the moment becoming unemployed in a short period of time. Construction lost 160 thousand people in three years. Transport jobs do not pay as well as construction did. But if the construction change caused most of our current economic issues it would be unwise to ignore a large sudden future change in transport employment.

To put some skin in the game, I am predicting that in 2025 in a period of three years we will see structural unemployment of about 5% of the workforce, half of those that work in transport.

Tuesday, December 13, 2011

Eradication Game Theory


Can you crowdsource disease eradictaion?

I mentioned in this post on 2030 that I expect Polio and Guinea worm to be eradicated by then. It becomes a tricky issue when a disease gets really uncommon how you find and treat the last few cases? So far only smallpox and rinderpest have been eradicated. Eradication is great because once its done its done. You would not have to immunise every child for polio any more. Every polio vaccine has a small cost and risk and once thats gone you can go spend the money on something better


India has tried an interesting tack 'Cash awards for info on diseases'
Alert the government on the occurrence of new cases of certain ailments and you may get a cash award! The government has targeted vaccine preventable diseases such as diphtheria, pertussis, measles, tetanus, and leprosy for elimination by 2016. India is also on the verge of being declared polio-free.
District medical and health officer Dr G. Srinivasulu explains that even after being declared polio-free, there should not be a single new case for 14 consecutive months in the country. This is where the reward comes in. “If anybody succeeds in detecting a new polio case meanwhile, the government will give a cash award. Even in case of detection of new leprosy cases, ASHA health workers are given Rs 150-Rs 200,” he said.


There was a competition last year from DARPA to encourage new ways to pool information held my many people.
'MIT wins $40,000 prize in nationwide balloon-hunt contest'

A team from the Massachusetts Institute of Technology won $40,000 in a high-tech scavenger hunt on Saturday by discovering the location of 10 red weather balloons.

"We're giving $2,000 per balloon to the first person to send us the correct coordinates, but that's not all -- we're also giving $1,000 to the person who invited them. Then we're giving $500 whoever invited the inviter, and $250 to whoever invited them, and so on..." it said.

Some similar system that set up a chain of reward could be really useful in disease eradication. Many security protocols rely on a sort of iterative proof of trustworthiness. Something similar could be used to allow steps toward eradication without fear some other country is going to stop efforts.

Assurance contracts are another approach. It is possible that some regions are scared that once a disease is eradicated to their area they will lose funds. Some way to guarantee that funding will not reduce or to reward successful eradication might help here. Something like Dominant assurance contracts might help to change incentives to encourage eradication.


How about a guarantee fund for each of the remaining countries with polio and guinea worm that when who declares them free they get some cash bonus. You could imagine a kickstarter project that gave the minister of health in Nigeria money when polio was declared eradicated from the country.

Another good plan is not to have fake immunisation drives against polio


The juice of the carrot, the smile of the parrot
A little drop of claret - anything that rocks
Elvis and Scotty, days when I ain't spotty,
Sitting on the potty - curing smallpox


We want to discourage deliberately being lax about a disease so you have to be clever about incentives. Anyone have any good idea for how you could bribe people and governments to further incentivise disease eradication?

Tuesday, August 09, 2011

Do Budget Cuts and Riots Go Together?


I saw this paper 'Austerity and Anarchy: Budget Cuts and Social Unrest in Europe, 1919-2009'
with the intro
'In the wake of this week's London riots, some commentators have linked the youth unrest to budget cuts. The authors of CEPR DP8513 explore the historical basis for this view and finds that austerity and violence have tended to go hand in hand.'

I am reading through the paper now. But I wonder if there was an image that could quickly show a connection between the two.

Wikipedia lists the riots since 1950 as

1958 Notting Hill race riots
1970 Garden House riot
1971 Priestlley riots
1975 Chapeltown race riot
1977 Battle of Lewisham
1980 St. Pauls riot
1981 England riots · Brixton riot · Chapeltown race riot · Toxteth riots · Moss Side riot · Handsworth race riots
1985 Brixton riot · Broadwater Farm riot
1987 Chapeltown race riot
1989 Dewsbury race riot
1990 Strangeways Prison riot · Poll Tax riots
1991 Meadow Well riots
1995 Manningham riot · Brixton riot
2001 Bradford riots · England riots · Oldham race riots · Harehills riot
2005 Birmingham race riots
2010 UK student protests
2011 London riots

Now if you look at the government spending as a percentage of GDP here. On top of this graph I put a bar for every riot each year one occurred.

Counting all riots as the same is not fair. Their graph goes from 34->48 whereas the riots go from 0->6. Laying the first on the second is not considered good practice in data visualisation. Also and this is a big one. If GDP drops as in a recession and the percentage of government spending to GDP stays the same total government spending will drop. a fairer graph would look at gdp or government spending adjusted compared to riots not the two combined.

The proper paper says rioting and austerity go hand in hand. I will read it carefully to see how close the link is. But a quick look at the data and no obvious major link jumps out at me.

Friday, June 17, 2011

Really Old Idea


Sports really annoys me. Particularly at the end when they get boring. When they know they have a minute to go in football they start kicking the ball between them and generally acting the micky. I thought I was dead clever when I thought that they should have random end times of sports. If you do not know when the game will end it is harder to try run down the clock.

Axelrod had the idea of random endings years ago. Many other game theorists have had similar ideas at various times.

Then I heard that random endings have a much longer history. Adapt the new book from Tim Harford explains one really old example. This century IBM got a patent for "a “smooth-finish” auction, an auction that is programmed to end at a random time". This gets over the problem on ebay where at the end of an auction people try not to bid what they value the item at but at just enough to win the auction just before it closes. So instead of people bidding one cent over the current bid with one second left on the auction.

Paul Klemperer pointed out that this idea is quite old. Even though the is a US patent for it.

In a candle auction, the end of the auction is signaled by the expiration of a candle flame, which was intended to ensure that no one could know exactly when the auction would end and make a last-second bid. Sometimes, other unpredictable processes, such as a footrace, were used in place of the expiration of a candle.

Pepys wrote about such an auction in the 1660's
Auction by candle was known in England by 1641, when it is mentioned in the records of the House of Lords.[6] The practice rapidly became popular, and in 1652, John Milton wrote, "The Council thinks it meet to propose the way of selling by inch of candle, as being the most probable means to procure the true value of the goods."


This 350 years old idea is my current record on simple ideas that someone has beat me to. Hartford's book Adapt is full of these sorts of interesting stories. This extract about the Spitfire gives you a good feel for the book.

Monday, February 28, 2011

A no lose lottery would help Haiti

In this post I want to try and persuade you that there is a form of lottery the Prize Linked Savings scheme that would be popular and fairly cheap to run for the people in Haiti. In my next post I want to explain why such a scheme would actually be useful

"PLS is a kind of savings account that pools some of the interest from all depositors and pays out a big lottery prize every month or so. It combines the thrill of the lottery with the safety of a savings account. It’s sometimes called a “no-lose lottery,” since a depositor is automatically entered into the lottery but can’t lose the original money she deposits."

Lotteries are incredibly popular in Haiti. Probably due to the crushing poverty there the hope and 'chance to dream' lotteries provide is seen as vitally important

"the lottery system in which an astonishing number of Haitians invest their income and their dreams." "At the time of the last official count, in 2005, the streets of Port-au-Prince were home to nearly 2,000 of them" (borlettes lottery shops) "– more than double the number of schools and universities in the city"."All told, Haitians spend as much as $1.5 billion per year on the borlette – a staggering amount in a country whose gross domestic product last year was $6.9 billion"

"You can bet two balls to come up at once, and if that happens you make a ‘marriage’ and win 500 times your bet. If your married numbers are consecutive, you win 1,000 times your bet. The Haitian dream is a bet of US $1,000 that reaps US $10,000 on a consecutive marriage. Many a hopeful future has been built on less." Borlette lottery in Haiti is remarkably popular which is a good indication that a lottery that also acts as a savings scheme will be popular

The overhead cost of these Haitian lotteries is relatively low as they use the numbers and thus the security mechanisms of outside lotteries. These lotteries tend to use the numbers from other countries lotteries for example the New York State Lottery or the Santo Domingo State Lottery

Another expense is the prize won in the lottery. You want your prize to be equivalent to a million euro. This is an amazing life changing amount in Ireland where the average wage is 35K. So a million is about 30 times average income. For Haiti this would be $730 *30= 21 thousand dollars. A million Haitian gourde is about 25 thousand dollars.

If we had a monthly prize of this much that would cost 12*25k=300 thousand a year in prizes. Say you double that with some smaller prizes. 600 thousand which if you were earning 3% interest means you would have to take in 10,000000 dollars. This is a lot of money but in the context of $1.5 billion spent on lotteries in Haiti it is not that much.

If you could take in ten million dollars you could run a no lose lottery in Haiti and use the interest to pay for the prizes. But why would you want to? I will explain in the next post why PLS would be useful to the people of Haiti

Friday, February 18, 2011

The Great Stagnation in Ireland

There is a new ebook by Tyler Cowen about how growth rates and progress in general has declined since 1973. There is a podcast here where he discusses the argument.

The book, is short you can read it in an evening, and published only in ebook format. It is a bit like an evening with your smart friend as he explains something rather than an economic treatise thats full of equations and aids insomnia. It is well worth the 4 dollars and few hours it takes to read.

Loads of commentators have examined various parts of the argument for stagnating progress. I even joined the argument here. I am going to try give a few datapoints that relate to Ireland that are part of the great stagnation argument here. Ireland has not been stagnating since 1973. In that time we moved from an improvished bachwards country to a modern well off one (and then slipped back somewhat again).
But there some areas where we are stagnating in similar ways, there are areas where we made similar mistakes to the Americans (and the rest of the OECD) and if we can expect a similar decline in growth here that means we should alter our expectations.

Stagnating medicine

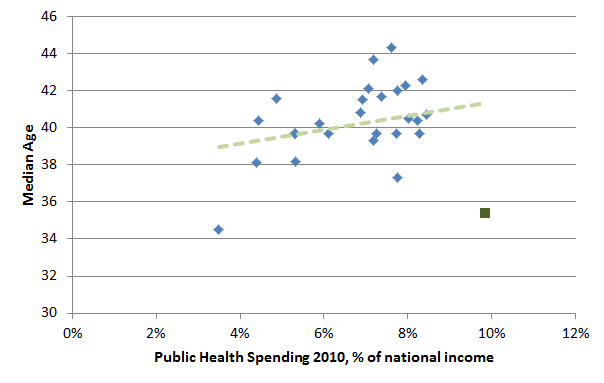
We spend too much on medicine and do not get good value for that spending. There is a piece here by Ronan Lyons where he argues convincingly that with our age profile we should be spending a third less than what we currently do on medicine


It is generally agreed that access to the health system in Ireland is bad. If we spend more than we should and people cannot get healthcare as easily as other OECD countries do it is fair to say that Irish healthcare is not improving our quality of life the way it should be

Stagnating education

'In the past decade, funding per student has been increased in real terms by 61 per cent, yet performance has decreased by 15 per cent.

This disconcerting news was reinforced before Christmas when the international ranking of the reading, mathematics and science skills of Ireland’s 15-year-olds was published. Reading skills dropped from fifth to 17th, the sharpest drop among 39 countries, with one quarter of all 15-year-olds classified as effectively illiterate. This was more politely termed in the report as “below the level of literacy needed to participate effectively in society”.'

We are spending more and getting less on education. Literacy is one of those basic measures that is hard to fake. Anyone who leaves school illiterate is a failure of our education system. In this school education area Ireland seems to have stagnating improvement.

Expecting too high growth
One of the major conclusions of the book is that Americans expected growth to continue at previous rates and this facilitated the financial crisis. People believed house prices would go up forever without wages increasing at the same rate. When people realised that they could not afford their debts and no one was going to buy them off them the house of cards collapsed.

In Michael Lewis' Vanity Fair piece makes a similar claim that Ireland expected too much growth
'An Irish businessman named Denis O’Brien sat on the board of the Bank of Ireland in 2005, when it was faced with the astonishing growth of Anglo Irish, which was about to double in size in just two years. “I remember the C.E.O. coming in and saying, ‘We’re going to grow at 30 percent a year,’” O’Brien tells me. “I said, How the fuck are you going to do that? Banking is a 5-to-7-percent-a-year growth business at best.”'

If the financial crisis in America was aided by delusions of future growth the Irish collapse was to an even greater extent.

Expecting growth to be much higher than it will be leads you to paying too much for things. For example buying empty buildings on the grounds that NAMA will make a profit on them eventually.

Other Claims
There is a very interesting section on how the internet might entertain us but does not provide many jobs. There is a similar argument to in "An Exodus Recession?" that because we can sit at home and look at youtube essentially for free the recession both does not feel as bad but is measurably worse as people do not go out and spend money on cinemas etc that employ people.
This does not relate specifically to Ireland though I do think the internet has improved our lives in ways that are hard to measure and that probably help those who like reading and arguing more than they help the average person.

Cowen also claims that increased emphasis on scientific research could again get progress moving faster again. I was watching Bronowski's the ascent of man last night from 1973, the year Cowen claims the stagnation began. Bronowski gives a warning that the next step in mankinds progress is dependent on science and that if we don't prevent scientific progress from stagnation some other civilisation will.


Expecting growth to return now

I have heard many people running for office who claim anyone who questions that we can return to the good old days of 5%+ growth of being unpatriotic. In this narrative our debts are huge but they were in the 1980's as well ans well soon have 5%+ growth that will evaporate our debts for us.

The evidence is that once countries get as rich as we are now their quick growth from playing catchup then slows. Some of us might be able to get more productive now but not nearly the increase that happened in the 90's when we went from working on farms producing vegtables and potatoes to producing Viagra and Pentiums.

We are not going to have the growth rates we had in the 90's we like the rest of the OECD have entered a period of lower growth, what Tyler Cowen calls 'the great stagnation'. Anyone who says we should plan for Ireland growing at a rate higher then the 6.7% interest rate on the ECB/IMF loan are is trying to get you to take on billions of their debt.

The great stagnation a great short book. Though its arguments apply to America the lessons of what they Japan and other countries who developed before Ireland are important for us to learn.

Thursday, February 17, 2011

Watson is better off having a three way competition

It seems non intuitive but I think Watson is more likely to win because its competition are so good. If you look at how well it did on Jeopardy here it seems to show Watson is better having humans splitting the points on questions it cannot answer as it is so quick to answer the ones it can.

When the humans buzz in they are right 19/23 about 83% of the time. Suppose Jennings was up against watson and me and I got zero buzz ins. Jennings may have gotten 11 of the buzz ins that Rutter got. Watson seems so fast on the buzzer that it seems to buzz first for nearly every question it could answer 44/50 times it tries to answer it is first.

This means that Jennings could nearly have doubled the number of answers he had but because there are two people who are really good at the sorts of questions only humans could answer these points are divided amongst the humans. Of the 23 human answers only 6 did Watson try to buzz in on.

There is a similar probability puzzle that might help in a three way duel. "You're a cowboy, and get involved in a three way pistol duel with two other cowboys. You are a poor shot, with an accuracy of only 33%. The other two cowboys shoot with accuracies of 50% and 100%, respectively. The rules of the duel are one shot per cowboy per round. The shooting order is from worst shooter to best shooter, so you get to shoot first, the 50% guy goes second, and the 100% guy goes third, then repeat. If a cowboy is shot he's out for good, and his turn is skipped. Where or who should you shoot first?"

Theres another explanation of a three way duel here.

Sometimes having 2 really good competitors increases your chances of winning.

Monday, January 31, 2011

Are Kitchens Better?

There is a really interesting debate going online right now about whether the rate of improvement in America and the west in general has slowed. The debate has been started by a book by Tyler Cowen called "the great stagnation" which I have yet to read.


Above is a graph from here of how quickly different products became popular
Paul Krugman raises a similar point about how American Kitchens have not improved much from the 1950's here where he points out "By any reasonable standard, the change in how America lived between 1918 and 1957 was immensely greater than the change between 1957 and the present."

You could argue that kitchen equipment is much cheaper than they were in the 1950's. Or that rice cookers, food processors and microwaves are a great improvement. Coffee machines are probably the exception to the stagnation rule as they do seem to have improved vastly. There is also the explanation that if your home kitchen has not improved maybe the kitchen that cooks your food has.

Has the big change been that people do not use their kitchens anymore? In a 1950's kitchen could you order a pizza to be delivered? Dominos started in 1960 according to the history of pizza delivery here so you probably could. I doubt Italian, Chinese, Mexican and Indian food were regularly delivered to ordinary peoples homes though.

Has the technology and labour moved from the domestic kitchen into industrial kitchens that now do 90+% of the work in preparing many of our meals? How much of the supposed lack of improvement could be explained in terms of more processing happening outside the home?

About 44 percent of food dollars are spent outside the home – a figure that started rising sharply in the 1970s, as more women joined the work force. Full-service restaurant revenue rose 5 to 7 percent a year in the decade leading up to the Great Recession”. So do seem to be eating out more?

Houses with small numbers of people cook less. And houses have less people nowadays, due to demographics. If people eat out more (or order in). Why would they buy some brand new kitchen invention? I have seen people with kitchens filled with shiny new equipment they have never used but I think this is fairly rare.


If the dial up pizza restaurant can have a new dough maker that is more efficient it makes sense for them. I can ring them up now and get the use of their new industrial standard food technology for the minute it takes them to make my pizza. Maybe home technology stagnated and the restaurant/supermarket/Microwave dinner technology improved?

I think it is worth noting that the improvements in Irish kitchens in this time have been huge. The 1918 world Krugman describes is superior to my grandmothers life in the mid fifties rural Ireland. She did not have running water or electricity and in her lifetime between 1950 and 1980 the changes she saw were massive.

Sunday, September 26, 2010

A failed Mturk translation test

The Mturk is Amazon's platform where you can put up jobs for people to do. These tend to be things like translation or image categorisation that humans are good at but computers are not.

According to Panos Ipeirotis' research mturk workers seem to be highly educated. The majority having degrees and about 10% having postgraduate degrees. Much mturk work is boring and probably does not use the skills these well educated workers have.

A few days ago google announced sponsorship for projects they think are carrying out good work. One winner was

"The Khan Academy will receive $2 million toward funding its work on the "make educational content available online for free" theme. The academy does just that, with a library of over 1,800 videos with lessons on math, science, finance, and history.

Bill Gates is a big fan of the Khan academy "This guy is amazing," he wrote. "It is awesome how much he has done with very little in the way of resources."
.

I am also a huge fan of the Khan academy I think that these videos and other online education videos such as MIT's online courses have amazing potential to transform the education of millions of people.

How far could googles 2 million grant stretch? Obviously it is up to Mr Khan to decide how to use his resources but I thought it would be interesting to see if the mturk could be used to translate one of his mathematics videos. The languages with over 100 million speakers are Mandarin, Spanish, English, Hindi, Bengali, Cantonese, Arabic,Portuguese, Russian and Japanese. 10 languages for 2000 videos would be 20,000 video translations. If each video cost 100 dollars to translate that would spend the 2 million dollars google donated. If this cost can be reduced more languages could be added.

A mathematics video is not something the average person can translate. However we know a large number of turkers have degrees and many are from India where they would likely have an understanding of English and Hindi or Bengali.

I tried an experiment to see if I could get one of Khan's videos translated into Hindi using the mturk at a cost of 5 dollars. Unfortunately I failed. The first person who accepted the task dictated what Khan said into text. Which is useful but not what I was looking for. The second person posted up another video on Solving linear inequalities in English not a translation of Khan's video.


This small experiment tells me that you need to be very clear on the mturk how you ask for a task to be completed. It also says that it might be worthwhile once you find someone who understands and completes the task to encourage them to translate other videos rather than rely on the vagaries of who happens to accept your mturk task.

This experiment ignored the problem of copyright. Khan owns his videos and it is unfair for someone to come along and copy him. I was not trying to steal any glory from Mr Khan with this experiment just to see if the mturk could be used to translate his videos.

Other people have successfuly used mturk to reduce the cost of translations. 'How I reduced translation costs of 200 articles from $9000 to $46' is an interesting article on one successful usage. This tells me that the problem was more likely with my unclear instructions than with the mturk platform. You can even monitor translations taking place in the mturk here so I still think this method would be cost effective. However my simple experiment failed.

Monday, August 09, 2010

Cat Bubbles

For something to be a bubble its price probably has to increase faster than inflation. People have to believe that other people believe it will increase in price forever. This is the madness of crowds effect like tulip mania in the 1600's where the price of Tulips rose to ridiculous levels.

I have heard arguments recently about higher education in the US being a bubble. But what about Pets? Animal based bubbles have a long and fun history. For example Alpaca's and Ostriches twice have been bubble commodities.

There is a really interesting article on how spending has changed during the recession here. It presents this table


From these figures could pets also be a bubble? The cat has hardly changed in thousands of years. Certainly not enough of a recent efficiency increase to make it worth a 14.4% growth in costs. So keep an eye on the costs of pet ownership especially of the fancier breeds to see if bubble thinking comes along.