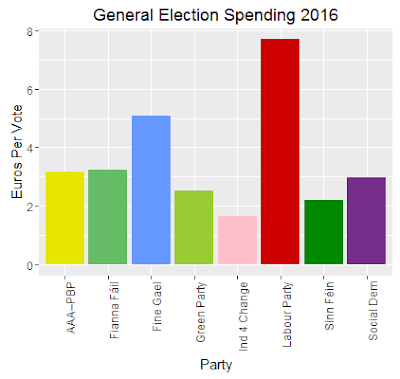
In the Irish election 2016 who paid the most for each vote and for each seat?
8394832.89
total spending (report here)
Electorate: 3305110
so €2.50 was spent on each vote. That is under half what is spend
on a US presidential vote.
On a
per seat and per vote basis
And on a Per Seat Basis
Party,"Votes,1st pref.",Seats,Spending
Fine Gael,544140,50,2768881.50
Fianna Fáil,519356,44,1687916.29
Sinn Féin,295319,23,650190.38
Labour Party,140898,7,1083718.38
AAA–PBP,84168,6,266942.48
Ind 4 Change,31365,4,51669.18
Social Dem,64094,3,190586.93
Green Party,57999,2,146792.27
and the r package code is
data <-  read.csv("spending.csv", header=TRUE)
datat <- mutate(data, perV = Spending/Votes.1st.pref., perS= Spending/Seats)

q<-  ggplot(data=datat, aes(x=Party, y=perV, fill=Party)) + geom_bar(stat="identity") +      scale_fill_manual(values=c("#E5E500", "#66BB66", "#6699FF", "#99CC33", "#FFC0CB","#CC0000", "#008800", "#752F8B"))
q <-q + theme(axis.text.x = element_text(angle = 90, hjust = 1))
q <-q + theme(legend.position="none")
q <-q + labs(title = "General Election Spending 2016")
q <-q + labs(y = "Euros Per Vote")

q<-  ggplot(data=datat, aes(x=Party, y=perS, fill=Party)) + geom_bar(stat="identity") +      scale_fill_manual(values=c("#E5E500", "#66BB66", "#6699FF", "#99CC33", "#FFC0CB","#CC0000", "#008800", "#752F8B"))
q <-q + theme(axis.text.x = element_text(angle = 90, hjust = 1))
q <-q + theme(legend.position="none")
q <-q + labs(title = "General Election Spending 2016")
q <-q + labs(y = "Euros Per Seat")


