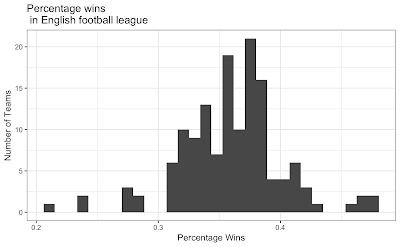
Baseball wins seem not to follow a normal distribution
There is a great R Package dataset of football results by James Curley here. This engsoccerdata has a function to generate soccer league tables of many countries over a long time period.
league<-maketable_all(df=england[,])
team GP W D L gf ga gd Pts Pos
1 Manchester United 962 604 209 149 1856 847 1009 2021 1
and create a new column for the percentage of wins
       league<-league %>%
    mutate(PercentW = W / GP)

p<-ggplot(data=league, aes(league$PercentW)) + geom_histogram()
#binwidth=20
p<-p + ggtitle("Percentage wins\n in English football league") +   xlab("Percentage Wins") + ylab("Number of Teams")
p<-p+theme_update(plot.title = element_text(hjust = 0.5))
p<-p + theme_bw()

       library(fitdistrplus)
library(logspline)
x<-league$PercentW
fit.norm <- fitdist(x, "norm")
plot(fit.norm)
shapiro.test(x)
Shapiro-Wilk normality test
data: x W = 0.96276, p-value = 0.0006663 Which means English football wins really do not have a normal distribution.
Goals per game are also not normally distributed. But I dont think anyone expectes them to be
league<-league %>%
    mutate(GoalsPgame = gf / GP)
shapiro.test(league$GoalsPgame)
Shapiro-Wilk normality test data: x W = 0.92134, p-value = 4.818e-07
And for France
Shapiro-Wilk normality test
data: leagueF$PercentW
W = 0.98522, p-value = 0.4699 so French football wins do not have might have (thanks for Paulfor the correction in the comments) a normal distribution. I must check the other leagues in the dataset as behaviour this different is odd.


2 comments:
If Shapiro-Wilk for French wins has a p value of 0.4699, why do you say the distribution is not normal?
Well spotted Paul. You are entirely right. I'll correct the blogpost
Post a Comment