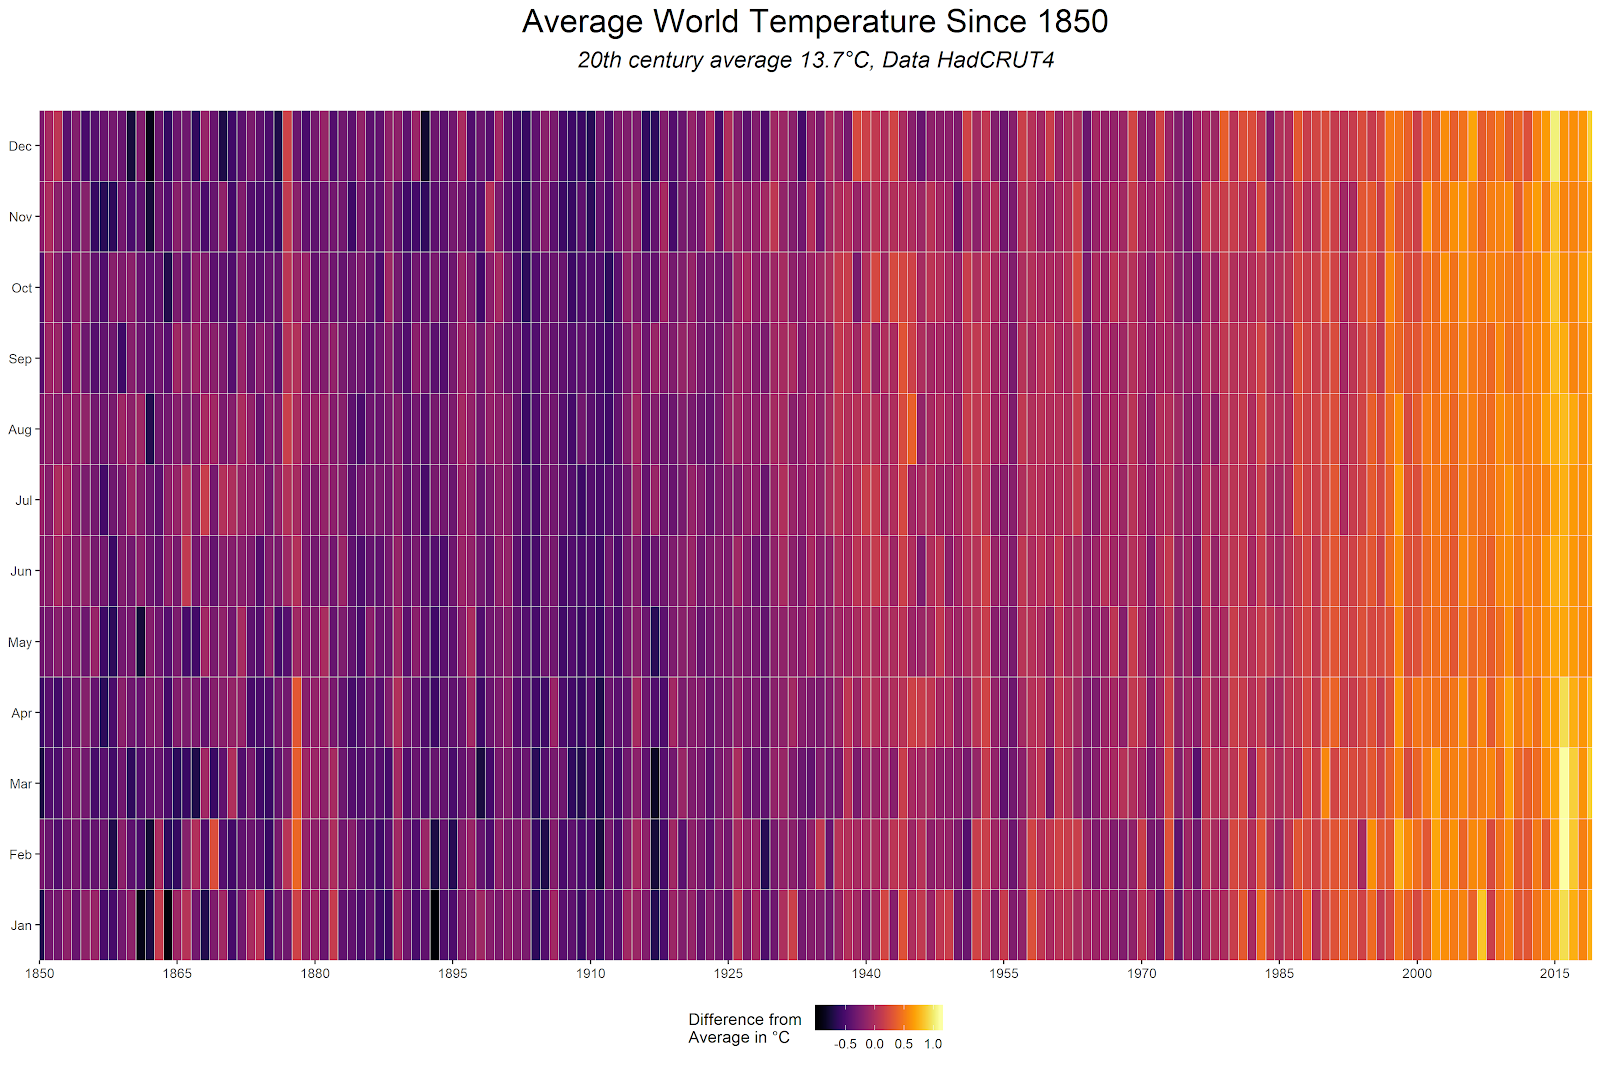
Code at https://gist.github.com/cavedave/8ff22e94c882e9f6be933f99f2ae0b50









Central England has weather data going back a long time. 1772 for daily average temperature and 1878 for maximum and minimum temperatures on each day.
2 times February the 25th since 1772 had an average temperature for the day above 10°C in Central England 1790 with 10.7°C, and 1922 with 11°C
The maximum temperatures observed in central England on the 25th of February were 1922 with 14.1,1953 with 13.1 and 1976 with 13.1 For those 140 years the maximum daily temperature averaged 6.6C.
I put the code to work all this out here. Graph of Feb 25th max temperature shows how weird 20°C is


It takes a while for the HADCET data to be updated. There is a nearby weatherstation http://www.weathercast.co.uk/world-weather/weather-stations/obsid/99060.html when I figure out the relationship between the two it will be possible to do a comparison between today and all the previous years.
Baseball wins seem not to follow a normal distribution
There is a great R Package dataset of football results by James Curley here. This engsoccerdata has a function to generate soccer league tables of many countries over a long time period.
league<-maketable_all(df=england[,])
team GP W D L gf ga gd Pts Pos
1 Manchester United 962 604 209 149 1856 847 1009 2021 1
and create a new column for the percentage of wins
       league<-league %>%
    mutate(PercentW = W / GP)

p<-ggplot(data=league, aes(league$PercentW)) + geom_histogram()
#binwidth=20
p<-p + ggtitle("Percentage wins\n in English football league") +   xlab("Percentage Wins") + ylab("Number of Teams")
p<-p+theme_update(plot.title = element_text(hjust = 0.5))
p<-p + theme_bw()

       library(fitdistrplus)
library(logspline)
x<-league$PercentW
fit.norm <- fitdist(x, "norm")
plot(fit.norm)
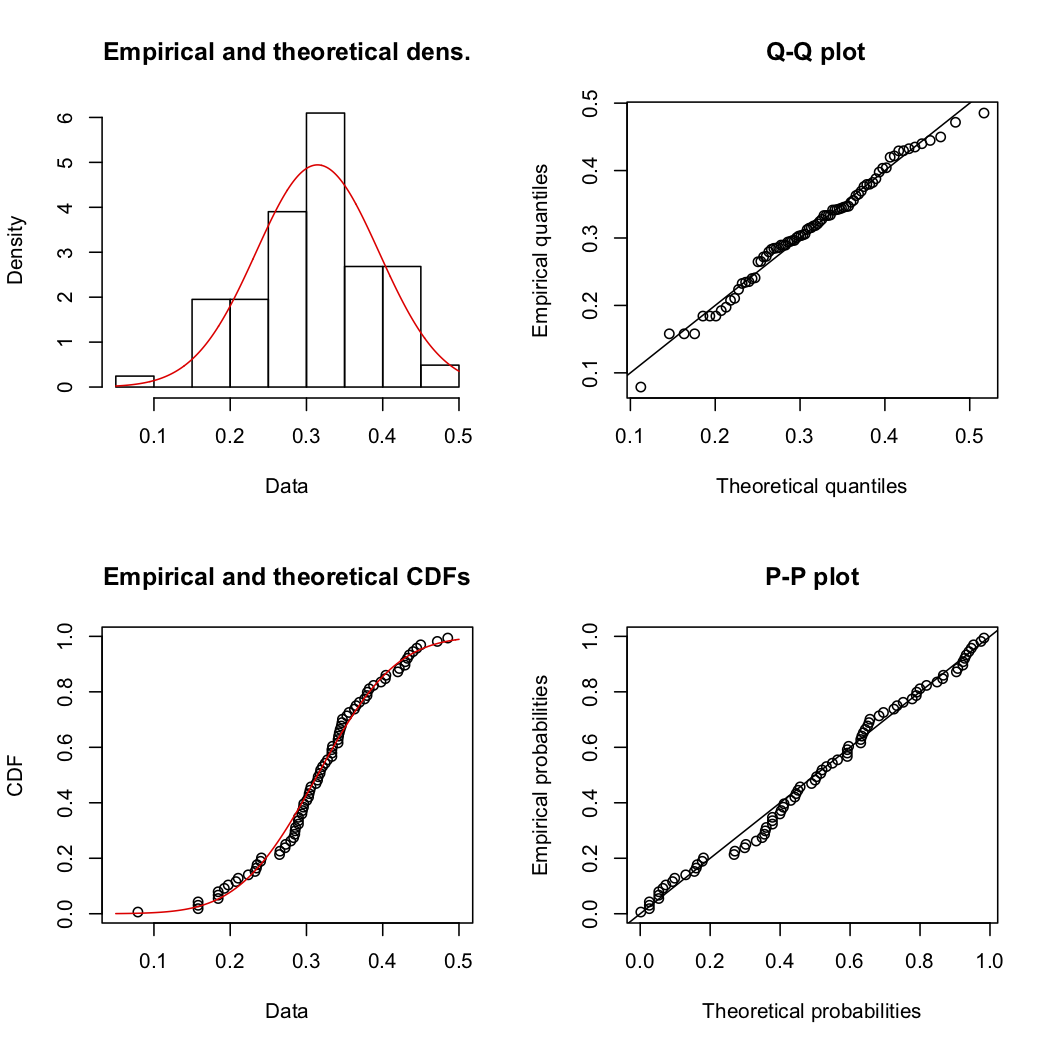
shapiro.test(x)
Shapiro-Wilk normality test
data: x W = 0.96276, p-value = 0.0006663 Which means English football wins really do not have a normal distribution.
Goals per game are also not normally distributed. But I dont think anyone expectes them to be
league<-league %>%
    mutate(GoalsPgame = gf / GP)
shapiro.test(league$GoalsPgame)
Shapiro-Wilk normality test data: x W = 0.92134, p-value = 4.818e-07
And for France
Shapiro-Wilk normality test
data: leagueF$PercentW
W = 0.98522, p-value = 0.4699 so French football wins do not have might have (thanks for Paulfor the correction in the comments) a normal distribution. I must check the other leagues in the dataset as behaviour this different is odd.

The French king sat opposite him and asked.
'Quid distat inter sottum et Scottum?' (What separates a sot [drunkard] from an Irishman?),
Eriugena replied, 'Tabula tantum' (Only a Table).
I think the gag setup still works 1200 years later.
What separates man from the animals?
The Liffey

How much do we need to reduce Carbon by?
We have committed to 'reducing greenhouse gas emissions by 40 per cent (compared to 1990 levels)'. Which is 60% of 56 million tonnes our carbon output by 40%. Which is 33.6 million tonnes of around 42.5% of our current carbon usage.
How would we do this?
On a personal level not an industrial one what would I have to do to reduce my carbon output by 40%? Please correct me if I am wrong here but roughly it seems to be
1. Get rid of my car. (as seen in Show Table: 2.5) 20% of our carbon output is Transport. Electric cars do not seem to be vastly more efficient than petrol ones.
2. Become Vegan. This seems to reduce food Carbon by about 40% .
3. Insulate the house and install energy efficient appliances. This seems to make less impact than cars and meat.
4. Sign up to airtricity. This one is easy enough.
How would this happen?
This all seems asking a lot. On transport Public transport subsidies would have to increase massively immediately. Even then 30% of Irish people live in the countryside which is really hard to do without a car.
It could be that rewilding the countryside means that we do not need to reduce carbon outputs by as much. But that would be a huge undertaking by itself.
Why is all this not being talked about? If I am totally wrong here please explain in the comments how to reduce by 40% in an easier way. If it is that we have to go vegan, live in cities and massively boost public transport starting immediately that seems to be a massive task.
1. Better healthcare. Cover Everybody, cost less and have lower deducables - No things got Worse. America's uninsured rate is on the rise.
2. "If Trump can deliver an average of more than 3% over his 4 years in office I think an impartial observer would agree the economy has done well." Didnt happen in year 1. "The economy grew 2.3 percent in 2017, better than the year before, but far short of what Trump is promising. Officials had focused on 3 percent GDP growth as proof his economic policies were working, and Trump has said it could go far beyond that target."
3. A balanced Budget. Didn't happen 'the House of Representatives passed its version of a tax reform bill that added an estimated $1.4 trillion to the federal deficit over the next decade.' The vote this year was not for an immediate reduction in the deficeit.
4. Infrastructure improvements didn't obviously happen but in fairness this would take time. So it cant be called based on the data that only goes up to 2016
Three of these measures did not succeed this year.
